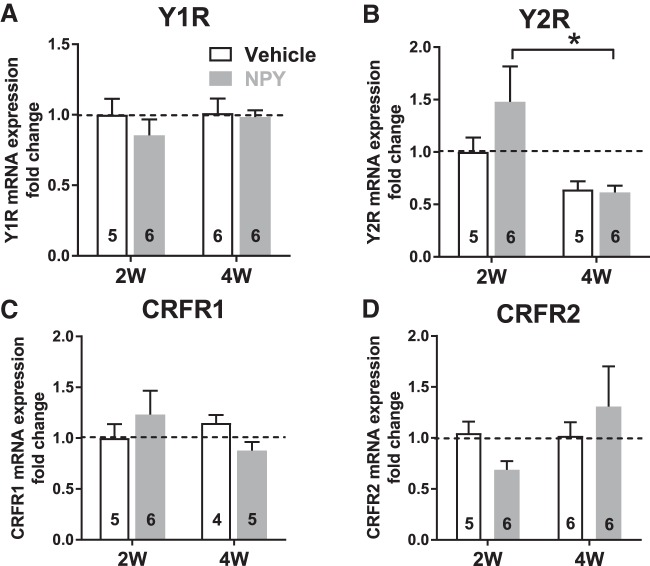
Figure 10.
qRT-PCR measurements reveal modulation of NPY2R expression in BLA. A, Y1R mRNA from 2W and 4W Veh- and NPY-treated BLA (2-way ANOVA; treatment: F(1,19) = 0.80, p = 0.38; time: F(1,19) = 0.53, p = 0.48; interaction: F(1,19) = 0.37, p = 0.55). B, Y2R mRNA from 2W and 4W Veh- and NPY-treated BLA. Y2R mRNA levels are decreased at 4W in the NPY-treated, but not Veh-treated group (2-way ANOVA; treatment: F(1,18) = 1.24, p = 0.28; time: F(1,18) = 9.12, p = 0.0074; interaction: F(1,18) = 1.57, p = 0.23). C, CRFR1 mRNA from 2W and 4W Veh- and NPY-treated BLA (2-way ANOVA; treatment: F(1,16) = 0.014, p = 0.91; time: F(1,16) = 0.36, p = 0.56; interaction: F(1,16) = 2.21, p = 0.16). D, CRFR2 mRNA from 2W and 4W Veh- and NPY-treated BLA (2-way ANOVA; treatment: F(1,19) = 0.025, p = 0.88; time: F(1,19) = 1.67, p = 0.21; interaction: F(1,19) = 1.99, p = 0.17). Numbers of animals studied are represented in each bar. *p < 0.05, Bonferroni's multiple-comparisons test.

