Figure 11.
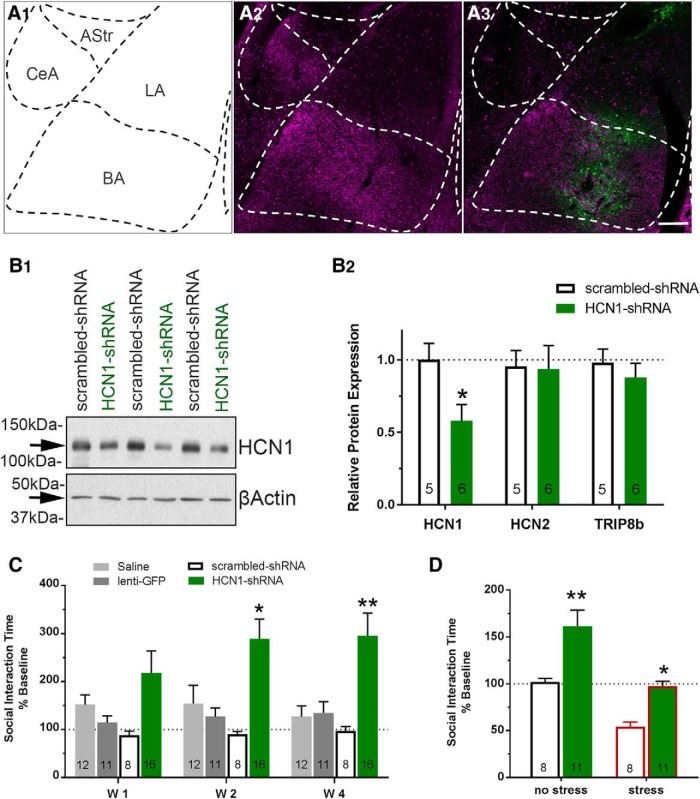
Knock-down of HCN1 in BLA with a lentivirus expressing an HCN1-shRNA construct increases SI times and induces resilience to restraint stress. A, Representative photomicrographs of lentivirus injection sites in the BLA. A1, Schematic representation of the BLA and surrounding structures at −3.30 mm from bregma (adopted from Paxinos and Watson rat brain atlas). A2, A3, Section of BLA showing HCN1 immunoreactivity (magenta; A2) with highest intensities in the BL from a naive uninjected rat and a representative injection placement for HCN1-shRNA (A3). Note the green cells indicating transfection (GFP) by the lentivirus. B1, Representative Western blot of HCN1and β-actin protein from the BLA of scr-shRNA- and HCN1-shRNA-injected rats (3 individual samples from each group at 4W after injection). B2, Amount of HCN1 protein was decreased significantly in the BLA of HCN1-shRNA- compared with scr-shRNA-injected rats (unpaired t test: t(9) = 2.61, p = 0.028), whereas HCN2 (unpaired t test: t(9) = 0.095, p = 0.93) and TRIP8b (unpaired t test: t(9) = 0.76, p = 0.47) levels in the BLA were unaffected by the treatment in the same animals. Protein levels were normalized to β-actin as an endogenous control and data are presented relative to scr-shRNA. N values are represented in each bar. Scale bar, 100 μm. C, SI time was increased significantly at 2W and 4W after HCN1-shRNA knock-down compared with sh-scrambled injected animals (2-way RM-ANOVA; treatment: F(3,43) = 6.29, p = 0.0012; time: F(2,86) = 1.73, p = 0.18; interaction: F(6,86) = 1.92, p = 0.086, mean ± SEM). D, Restraint stress decreased SI time in both scr-shRNA and HCN1-shRNA-treated animals; however, knock-down of HCN1 prevented the reduction of SI below the respective baseline control values (2-way ANOVA; treatment: F(1,34) = 28.07, p < 0.0001; stress: F(1,34) = 7.95, p = 0.0080; interaction: F(1,34) = 0.56, p = 0.46). Significant differences in poststress SI times were noted between the scr-shRNA and HCN1-shRNA groups. SI time was decreased significantly relative to pretreatment baseline after restraint stress in the scr-shRNA-treated animals (paired t test; t(10) = 4.83, p = 0.0007), but not in the HCN1-shRNA-treated animals (paired t test; t(7) = 0.29, p = 0.78). *p < 0.05, **p < 0.01, ***p < 0.001, ****p < 0.0001, Bonferroni's multiple-comparisons test or t test where appropriate.

