Figure 3.
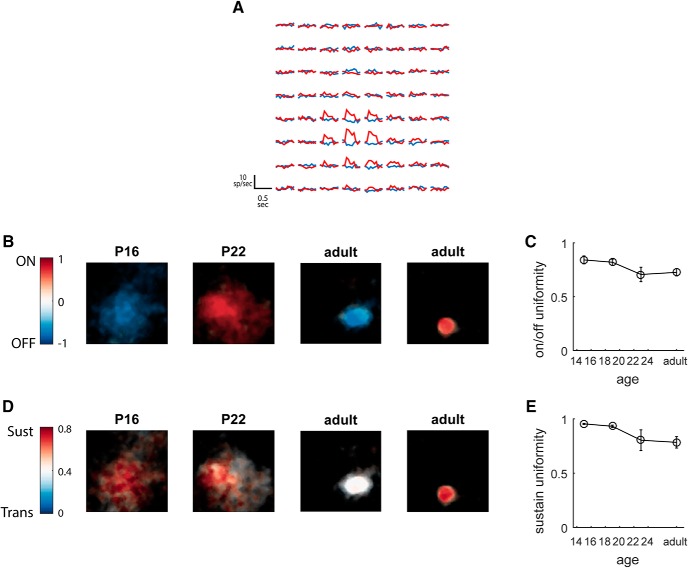
Tuning properties are homogeneous across the spatial receptive field throughout development. A, Time course of response to light and dark spots mapped across the visual field, for the On sustained unit shown in rightmost panels of B and D. Plots are from individual pixel locations at 4° spacing. B, Examples of spatial distribution of On/Off responses at P16, P22, and adulthood. Color represents the On/Off index at each point (−1 for Off, +1 for On), and brightness represents amplitude of STA receptive field. Scale bar, 10°. C, Average uniformity of On/Off tuning over the course of development. D, Examples of spatial distribution of sustained/transient tuning at P16, P22, and adulthood. Color represents the sustain index at each point, and brightness represents amplitude of STA receptive field. Scale bar, 10°. E, Average uniformity of sustained/transient tuning over the course of development.

