Fig. 3.

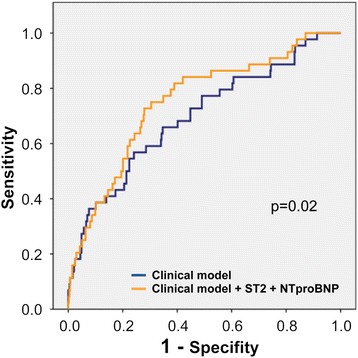
The area under the curve (AUC) for the primary composite endpoint at 30 days for the clinical model and the model with ST2 and NT-proBNP. The clinical model included age, sex, diabetes, urea, Charlson comorbidity index, and Barthel index

The area under the curve (AUC) for the primary composite endpoint at 30 days for the clinical model and the model with ST2 and NT-proBNP. The clinical model included age, sex, diabetes, urea, Charlson comorbidity index, and Barthel index