
Fig. 6.
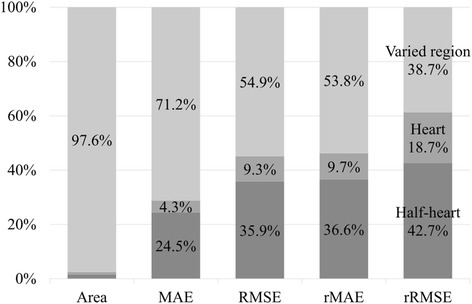
Contribution of each mask generation step. For each bar, the steps from top to bottom are varied region, heart region and half-heart region. For the Area bar, the contributions of heart and half-heart regions are 0.8% and 1.6%, respectively
Official websites use .gov
A
.gov website belongs to an official
government organization in the United States.
Secure .gov websites use HTTPS
A lock (
) or https:// means you've safely
connected to the .gov website. Share sensitive
information only on official, secure websites.
Contribution of each mask generation step. For each bar, the steps from top to bottom are varied region, heart region and half-heart region. For the Area bar, the contributions of heart and half-heart regions are 0.8% and 1.6%, respectively