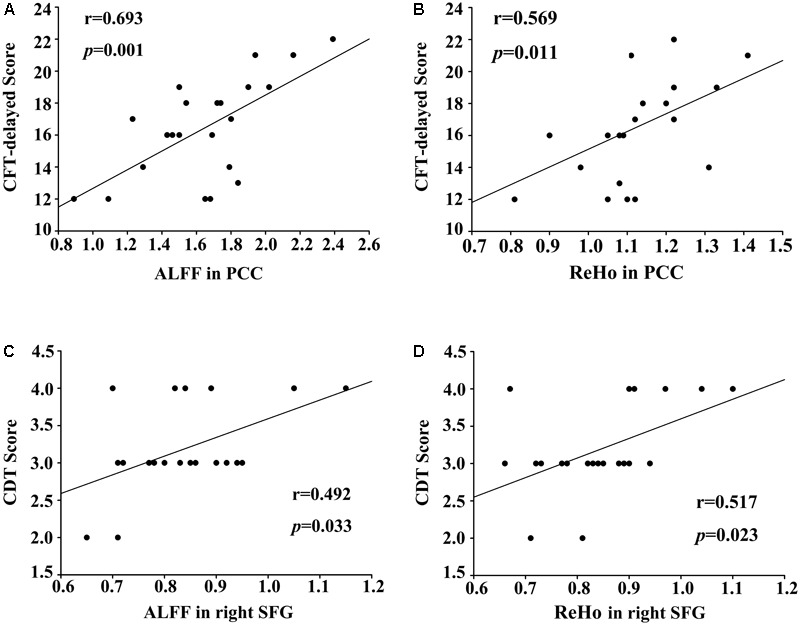
FIGURE 4.

(A) Correlations between the CFT-delayed scores and decreased ALFF values in the PCC (r = 0.693, p = 0.001). (B) Correlations between the CFT-delayed scores and decreased ReHo values in the PCC (r = 0.569, p = 0.011). (C) Correlations between the CDT scores and reduced ALFF in the right SFG (r = 0.492, p = 0.033). (D) Correlations between the CDT scores and reduced ReHo in the right SFG (r = 0.517, p = 0.023).
