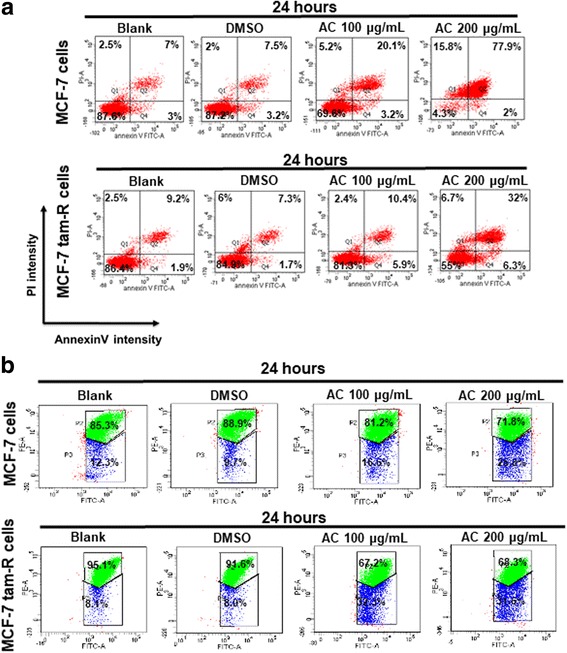
Fig. 3.

AC induces apoptosis in breast cancer cells. Breast cancer cells were treated without or with indicated compounds for 24 h. Cell apoptosis was detected by flow cytometry with annexin-V-FITC/PI dual staining or mitochondrial membrane potential assay (mitoscreen JC-1 staining assay). a For annexin-V-FITC/PI dual staining, the representative histograms of flow cytometric analysis using double staining with annexin-V-FITC (FITC-A) and PI (PI-A). Q1 (annexin-V−/PI+) show necrosis cells; Q2 (annexin-V+/PI+) show the late apoptosis cells; Q3 (annexin-V−/PI−) show normal cells; Q4 (annexin-V+/PI−) show the early apoptosis cells. b For mitochondrial membrane potential assay (mitoscreen JC-1 staining assay), dot Plots revealing depolarization of mitochondria in treated HCT 116 cells. The percentage of events in the upper gate (P2) and lower gate (P3) represent population of treated breast cancer cells having normal and depolarized mitochondria respectively
