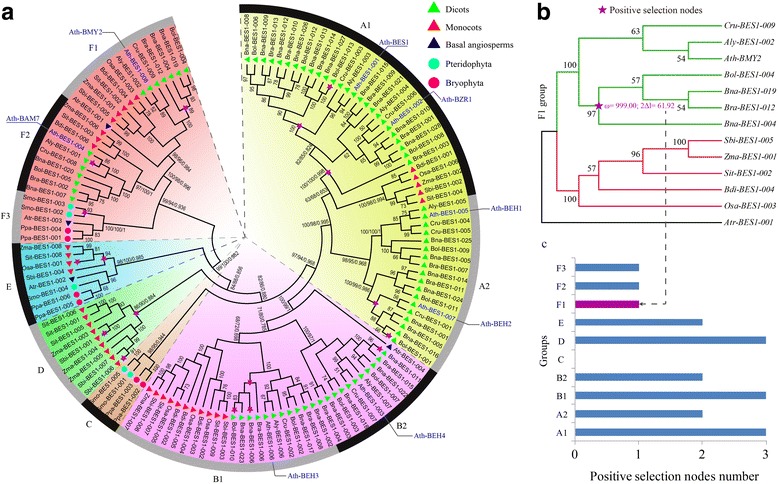
Fig. 2.

Phylogenetic relationship and positive selection analyses of the BES1 gene family. a Phylogenetic tree topology was generated via MEGA6.0. For the major nodes, neighbour-joining (NJ) and maximum-likelihood (ML) bootstrap values above 50% are shown, followed by Bayesian posterior probability values (> 0.6) by MrBayes. The A to F indicate the groups obtained by the bootstrap values and phylogenetic topology. b Positive selection analyses of groups F1 in representative species. The ω on the clades is the dn/ds value under the M8 model of codeml. c The positive selection nodes number in each group in the representative species
