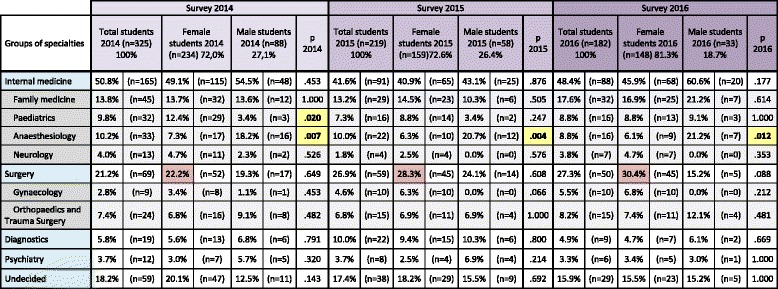
Table 2.
Specialty distribution over a period of three consecutive years [29]

Percentages and numbers respectively relate to each year. White fields: Data for the five large groups of medical specialties. Grey fields: Data for some individual medical specialties. Yellow fields: The p-values of individual medical specialties with large differences in the specialty preference between female and male students. Purple fields: Percentages of female students preferring surgery
