
Fig. 4.
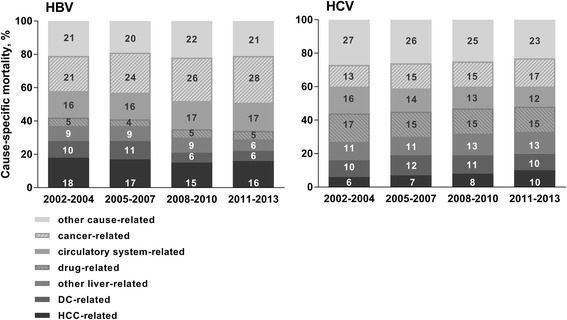
Percentage of deaths due to different underlying causes among people with an HBV and HCV notification, NSW 1993-2012, n = 150,403
Official websites use .gov
A
.gov website belongs to an official
government organization in the United States.
Secure .gov websites use HTTPS
A lock (
) or https:// means you've safely
connected to the .gov website. Share sensitive
information only on official, secure websites.
Percentage of deaths due to different underlying causes among people with an HBV and HCV notification, NSW 1993-2012, n = 150,403