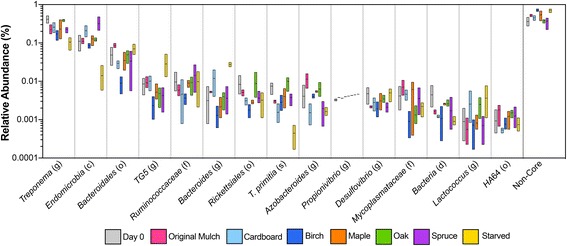
Fig. 2.

Effect of diet on the core and non-core taxa in the hindgut. The relative abundance of sequences from OTUs present in the core and non-core taxa were calculated for each diet. The boxplot ranges from the minimum to maximum abundance values, with a line at the mean. No diet had a significant effect on sequences from the core taxa as compared to the initial day 0 abundances
