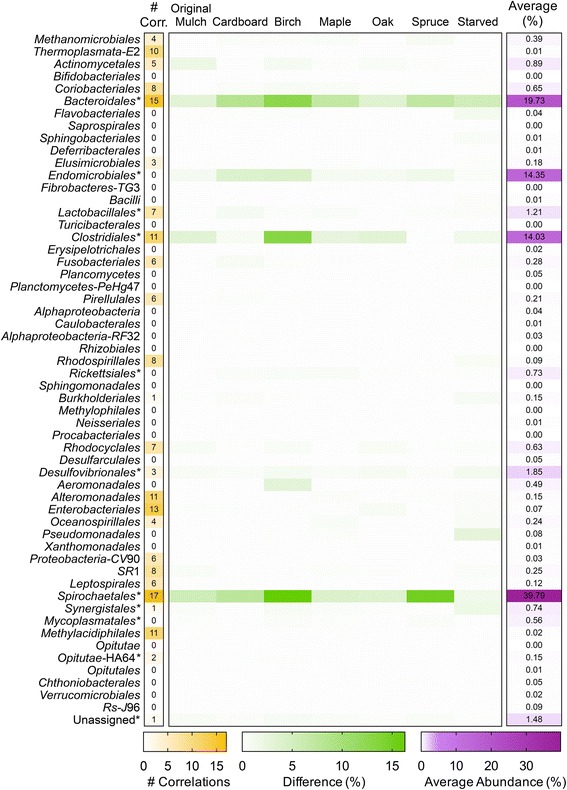
Fig. 4.

Accuracy of the ANN to predict taxonomic abundances. In training the ANN, one sample per random time point for each diet (along top) was left out and used to test the accuracy of the ANN. The measured abundances of taxa (order) in the samples were compared to the abundances predicted by the ANN. The taxa represented in the core microbiota are denoted by an asterisk, and the average abundances are plotted in the right column (purple). The difference between the actual values and predicted values was calculated and shown in green. The number of significant correlations for each taxon is also shown in the left column (yellow). The ANN was able to predict the taxonomic abundance of each taxon within less than 16% of the measured value. The taxa with the largest differences were present at average abundances of > 14%; therefore, the differences could be due to background noise. The majority of predicted values were < 1% different from the measured values
