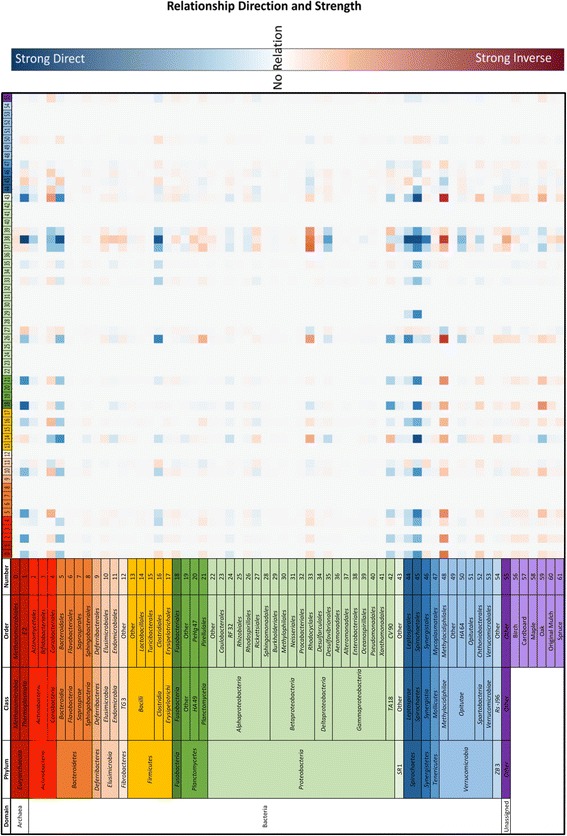
Fig. 5.

2D heatmap of influences of taxa and substrates on other taxa. The abundance of each taxon/substrate is labeled on the left and corresponding taxa are numbered across the top. Each taxon abundance value was changed by ± 5% (present/absent for substrate), and the effect on the remaining taxa is shown in the heatmap. Direct correlations are shown in blue, and inverse correlations are shown in red
