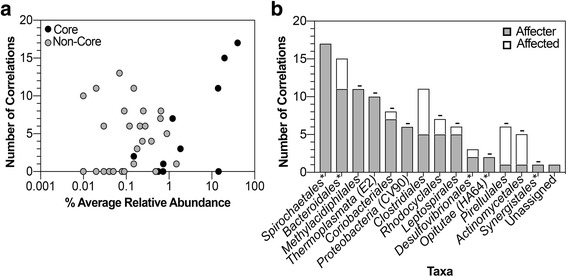
Fig. 7.

Significantly correlated taxa in the hindgut. a A taxon was considered significantly correlated if the value in the heatmap (Fig. 5) was above three standard deviations of the absolute average of the relative-change matrix generated. b Core taxa are designated with an asterisk, while taxa < 1% abundance are designated with a minus sign. The majority of significant correlations belong to non-core, low-abundant taxa
