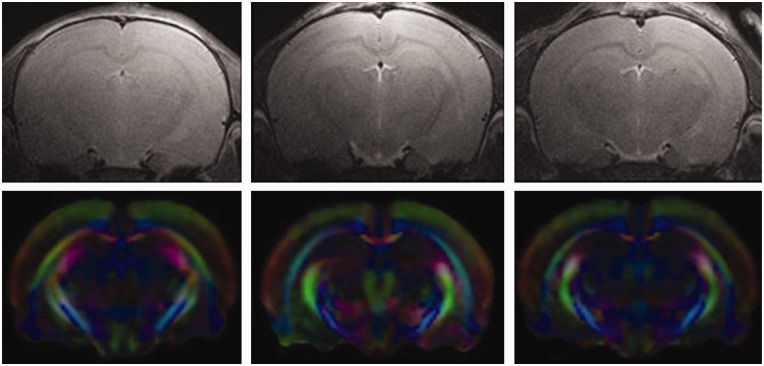
Figure 2.
Representative in vivo images. Top row, T2-weighted anatomical images for sham (left), mTBI (middle), and rmTBI (right). Bottom row are directionally encoded color maps for sham (left), mTBI (middle), and rmTBI (right). Colors represent fiber direction, red is left/right, green is dorsal/ventral, and blue is rostral/caudal.

