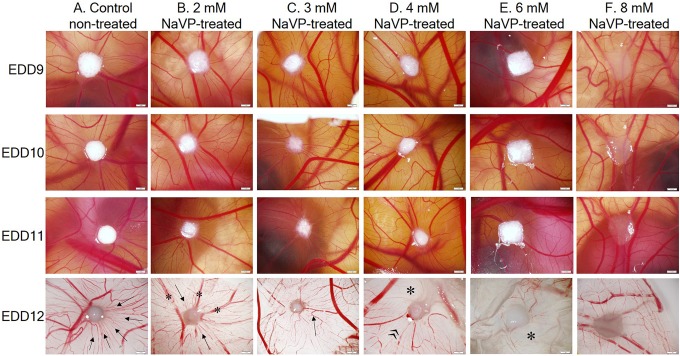
Figure 1.
Dynamic changes of H146 cell tumor morphology formation on the CAM from EDD9 to EDD12 in the study groups. The view of CAMs with tumors on the EDD9 to EDD11, captured via a window in the eggshell, and the EDD12 tumors on CAMs were photographed after removing them from the egg (bottom view). Scale bar 1 mm. A, CAM with tumors formed of cells in the nontreated group (control), arrows indicate blood vessels. B, CAM with tumors formed of the 2 mmol/L NaVP-treated cells, blood vessels of different diameter are shown by arrows and asterisks. C, CAM with tumors formed of the 3 mmol/L NaVP-treated cells, the arrow indicates a blood vessel. D, CAM with tumors formed of 4 mmol/L NaVP-treated cells, the asterisk and the quotation mark indicate different zones of the CAM around the tumor. E, CAM with tumors formed of the 6 mmol/L NaVP-treated cells, the blood vessel free zone is pointed by an asterisk. F, CAM with tumors formed of 8 mmol/L NaVP-treated cells. CAM indicates chorioallantoic membrane; EDD9, ninth day of embryo development; EDD11, 11th day of embryo development; EDD12, 12th day of embryo development; NaVP, sodium valproate.

