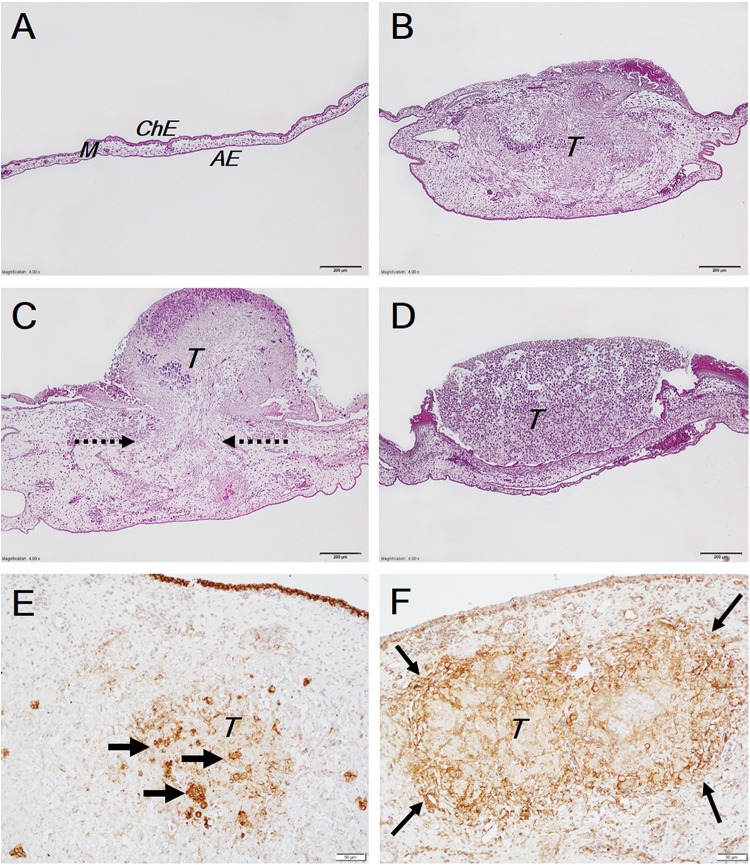
Figure 2.
Tumor invasion into the CAM. The A, B, C, and D histological pictures show different views of the CAM: A, intact CAM (control); B, complete tumor invasion into the CAM mesenchyme; C, partial tumor invasion (pointed by arrows) into the CAM mesenchyme through the destroyed chorionic epithelium, the tumor cells also spread along and are seen on the CAM surface; D, noninvaded tumor is present on the concave CAM. The E and F immunohistochemical pictures show the expression of epithelial and mesenchymal markers respectively: E, the E-cadherin expression, positive tumor cells are pointed by arrows, the E-cadherin positive expression in ChE is also seen at the top of the picture as a brown line. F, the N-cadherin expression is seen to be stronger at the edges of the tumor; contrary to E-cadherin, here the N-cadherin is not expressed in ChE of the CAM. Scale bar: A-D, 200 µm and E and F, 50 µm. AE indicates allantoic epithelium; CAM, chorioallantoic membrane; ChE, chorionic epithelium; M, mesenchyme; T, tumors.

