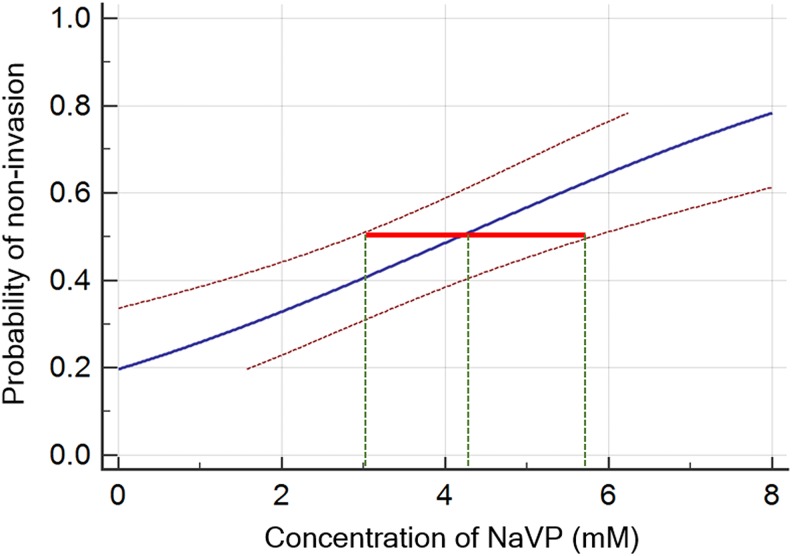
Figure 3.
The probability of tumor noninvasion into the CAM. The concentration response analysis for evaluating the probability of tumor noninvasion when using different NaVP concentrations ranging from 2 to 8 mmol/L. A red line indicates the 95% confidence interval (CI) corresponding to the median effective NaVP concentrations (ED50: dashed green line crossing the blue line). CAM indicates chorioallantoic membrane; NaVP, sodium valproate.

