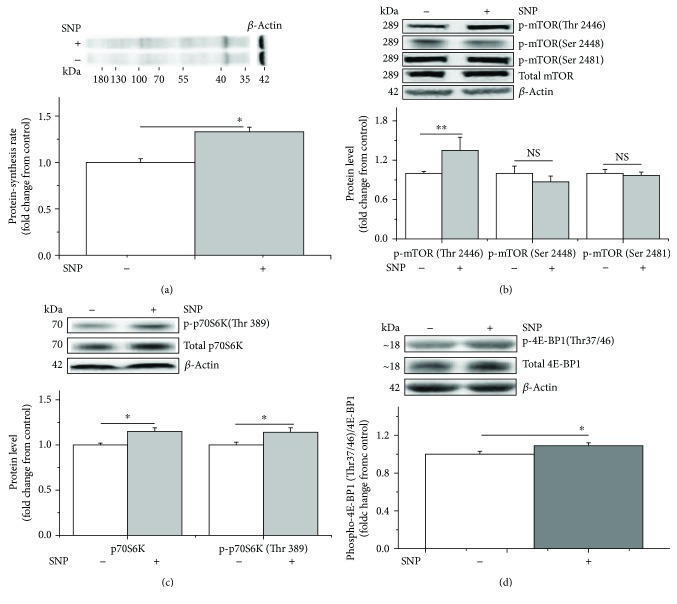
Figure 5.
SNP treatment increases the protein synthesis rate and the phosphorylated levels of mTOR (Thr 2446), p70S6K (Thr 389), and 4E-BP1 (Thr 37/46) in C2C12 cells. The protein synthesis rate was evaluated following treatment by supplementation with puromycin (10 μM) for 30 min in the cell-free supernatant (a). Levels of phosphorylated mTOR (b), p70S6K (c), and 4E-BP1 (d) in C2C12 cells in the presence of 1 μM of SNP. When the total protein bands showed significant differences with different treatments, the phosphorylated protein bands were normalized to the total protein bands. In contrast, if the total protein bands were similar across different groups, both the phosphorylated and total protein bands were normalized to β-actin. Data are presented as the means ± SEM (n = 6). ∗∗P < 0.01 and ∗P < 0.05 compared with untreated cells. NS, P > 0.05.

