. 2018 Apr 12;9(18):4258–4267. doi: 10.1039/c8sc00832a

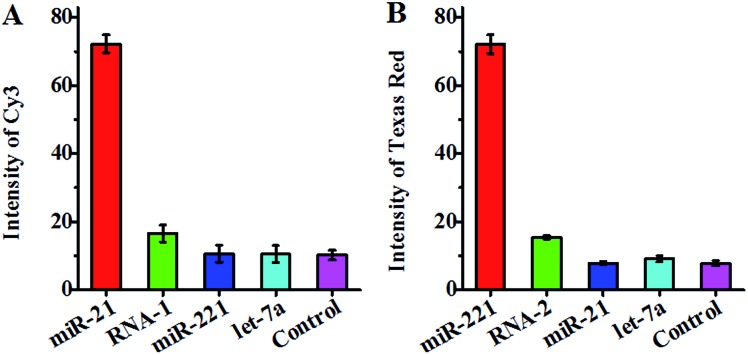
Fig. 4. (A) Measurement of the Cy3 fluorescence signal in response to miR-21 (red column), single-base mismatched RNA (RNA-1, green column), miR-221 (blue column), let-7a (cyan column), and the control without any miRNA (magenta column) using circular template-21. (B) Measurement of the Texas Red fluorescence signal in response to miR-221 (red column), single-base mismatched RNA (RNA-2, green column), miR-21 (blue column), let-7a (cyan column), and the control without any miRNA (magenta column) using circular template-221. The concentration of each miR-21, miR-221, RNA-1, RNA-2, and let-7a is 0.1 nM. Error bars show the standard deviation of three experiments.

Fig. 4