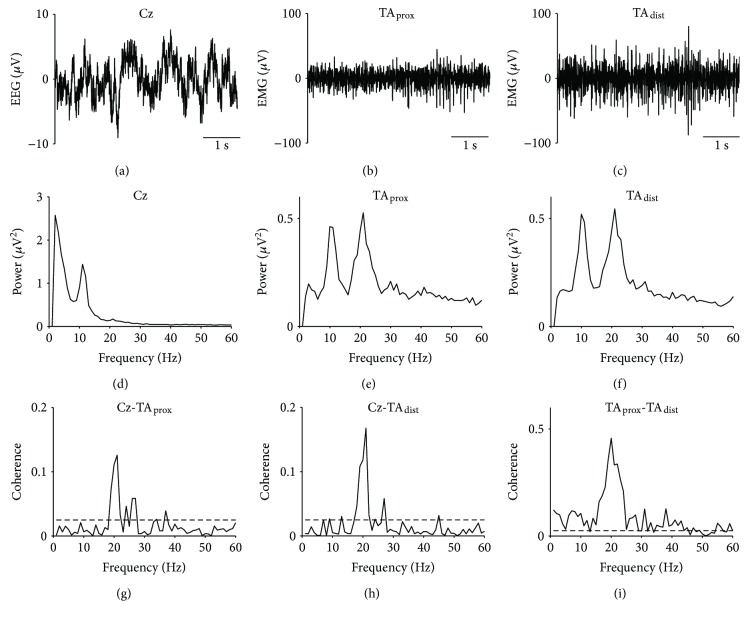
Figure 3.
Raw EEG and EMG traces, autospectra, and coherence results from a single young subject. EEG from Cz (a), EMG from proximal (b), and distal (c) ends of the anterior tibial muscle (TAprox and TAdist, resp.); autospectra for Cz (d), TAprox (e), TAdist (f); and coherence for Cz-TAprox (g), Cz-TAdist (h), and TAprox-TAdist (i) during static dorsiflexion. Dashed lines on coherence plots indicate upper 95% confidence interval limits.

