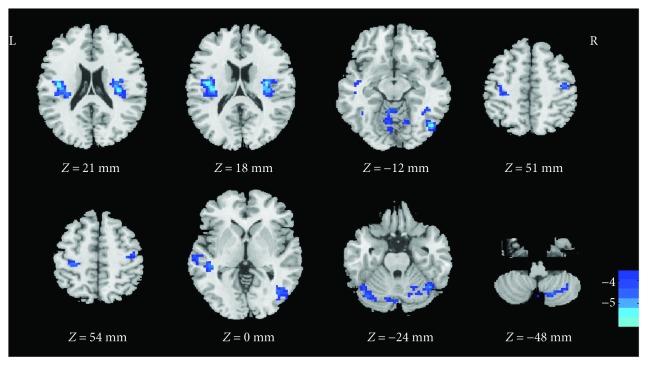
Figure 2.
Regions showing a different functional connectivity between the dancer group and the control group when the inferior frontal gyrus was used as the seed. The color bar indicates the t-values. The dark to light blue color means the negative values (dancer group minus control group). Clusters with P < 0.01 (GRF corrected) and a spatial extent k > 20 voxels were considered statistically significant.

