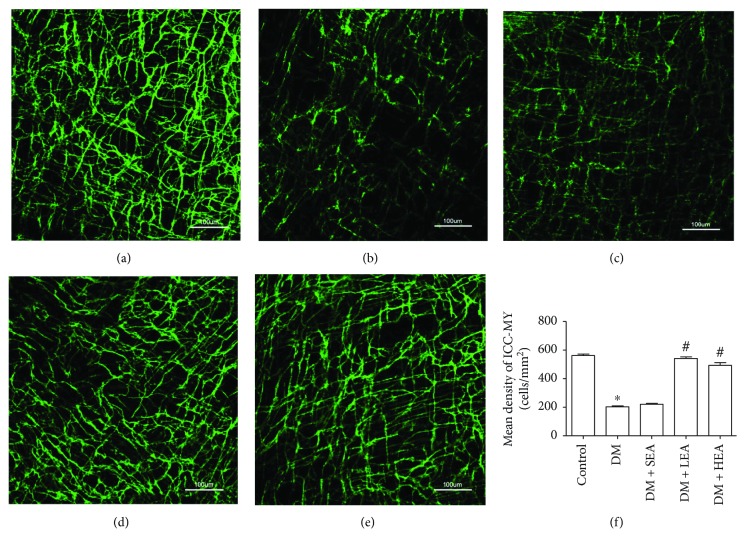
Figure 1.
Immunofluorescence of ICC networks labeled in Auerbach's plexus by Ano1. Plenty of ICC with long and abundant branches were observed in the control group (a). ICC networks were heavily decreased with disrupted processes in the DM group and the SEA group (b, c). However, in the LEA and HEA groups, the networks of ICC presented near the normal levels in the control group (d, e). Quantitative analysis of ICC density was performed in each group (f). N = 5 for each group, and two random fields (×200 magnification, 0.2607 mm2) per whole-mount preparation were used. ∗P < 0.05 compared with the control group, and #P < 0.05 compared with the DM group. Scale bars = 100 μm.

