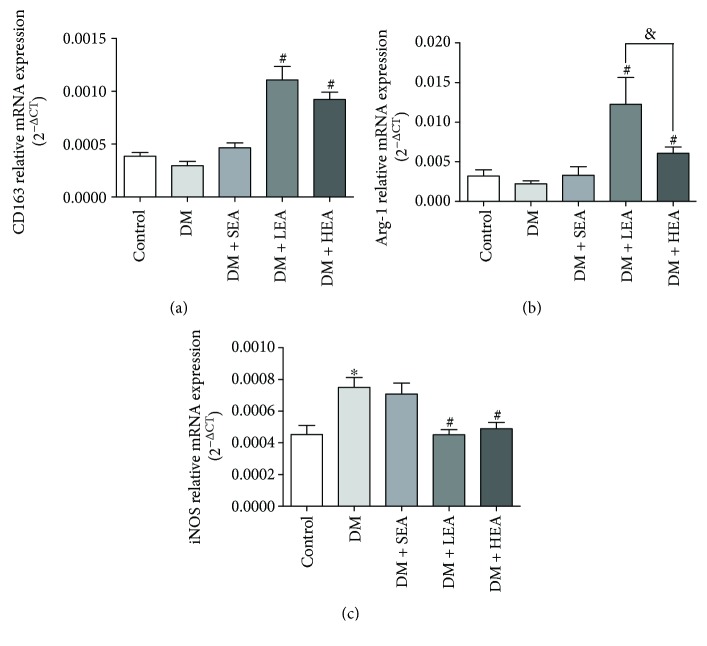
Figure 5.
Expression levels of CD163, arginase-1, and iNOS mRNA in each group: (a) changes of mRNA expression levels of CD163, (b) arginase-1, and (c) iNOS in each group, respectively. N = 5 or 6 for each group. ∗P < 0.05 compared with the control group, #P < 0.05 compared with the DM group, and &P < 0.05 among the LEA group and the HEA group.

