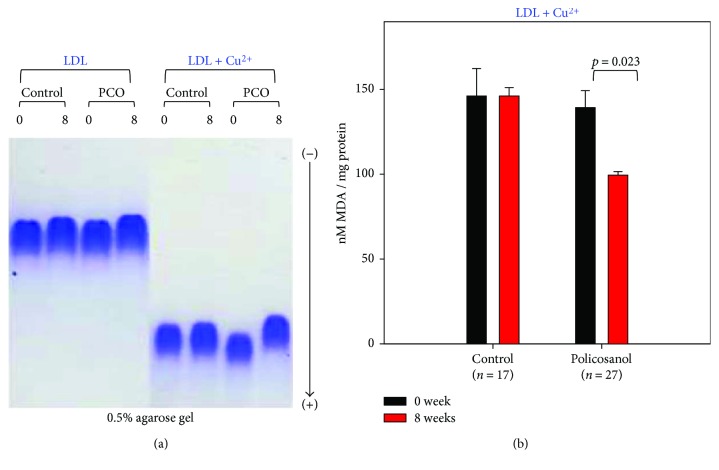
Figure 3.
Comparison of LDL oxidation extent during policosanol consumption. (a) Comparison of electromobility of LDL between weeks 0 and 8 with or without cupric ion on a 0.5% agarose gel. (b) Determination of oxidized species using the thiobarbituric acid reactive substance method in LDL (1 mg of protein) in native state at weeks 0 and 8 (bar represents the standard deviation of the mean).

