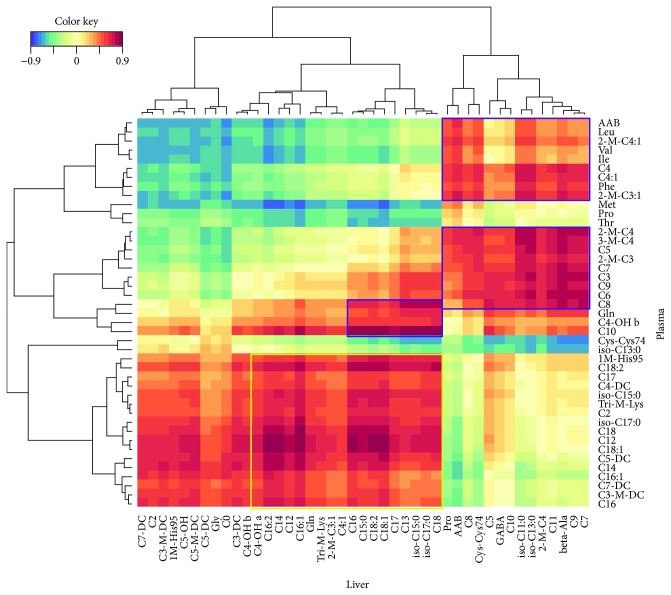
Figure 4.
Heat map of hierarchical clustering of plasma and liver metabolites from diabetic (Md) and non-/prediabetic (M) male NZO mice. Highly correlating metabolites from plasma and liver are marked with coloured frames, while purple frames comprise mainly BCAA-derived and MCFA-derived ACs while yellow-marked frames comprise mainly LCFA-derived ACs. The threshold for the absolute correlation was set to at least 0.6. The colour scale reflects the distance score between each metabolite pair, with dark red indicating strong positively correlated pairs of metabolites and blue indicating strong negative correlations.

