
Fig. 3. HIF2A mutations activate downstream targets and reduce expression of nerve growth factor (NGF)-induced chromaffin differentiation markers in pheochromocytoma cells.
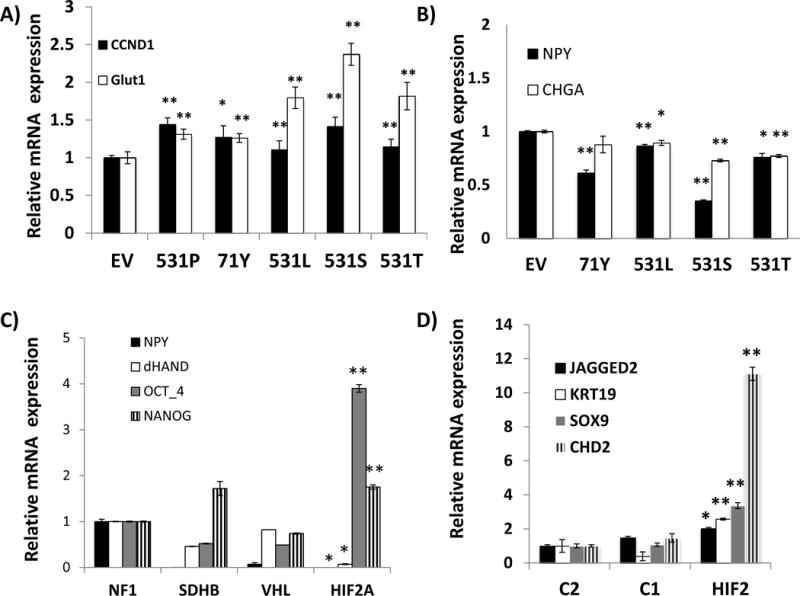
A) Expression levels of CCND1 and GLUT1 (SLC2A1) transcripts of undifferentiated PC12 cells stably expressing an empty vector (EV), the indicated HIF2A mutants (Ser71Tyr=71Y, Pro531Thr=T, Pro531Leu=L, Pro531Ser=S) or a wild-type (P) HIF2A construct by quantitative real time PCR (qRT-PCR). Samples were run in triplicate and experiment was repeated twice. Results are shown as the average and bars represent standard error of the means. Values of EV-expressing cells were set to 1(*indicates statistical significance between each HIF2A-mutant and empty vector at p <0.05; ** indicates statistical significance between each HIF2A-mutant and an empty vector at p <0.001). B) Expression levels of NPY and CHGA transcripts by qRT-PCR of PC12 cells stably expressing the designated HIF2A constructs or an empty vector (EV) after 7 days exposure to 50ng/ml NGF (*p<0.001 EV vs. all mutants, **p<0.0001 EV vs. all mutants), performed as in (A). C) Expression of NPY, dHAND, OCT4 and NANOG transcripts in HIF2A-mutated paraganglioma from sample 9 along with other pheochromocytomas carrying mutations of VHL, SDHB or NF1 genes. Samples were run in triplicate. Results are shown as the average and bars represent standard error of the means. Values of NF1 samples were set to 1. All results were statistically significant between the HIF2A-mutant tumor and NF1 at p<0.01* or p<0.001**) D) Expression of stemness-related genes JAGGED2, KRT19, SOX9 and CHD2 in transcripts obtained from microarray-based profiling of combined HIF2A-mutant tumors (37 and 208= HIF2) in comparison with pheochromocytomas mutated for NF1, TMEM17 genes (C2=cluster 2) and VHL, SDHB, SDHD genes (C1= cluster 1), as detailed in Methods. Values of the C2 cluster samples have been set to 1 (* indicates statistically significant difference between HIF2A-mutant and C2 tumors; ** indicates statistically significant difference between HIF2A-mutant samples and both C1- and C2- tumors, at p<0.05).