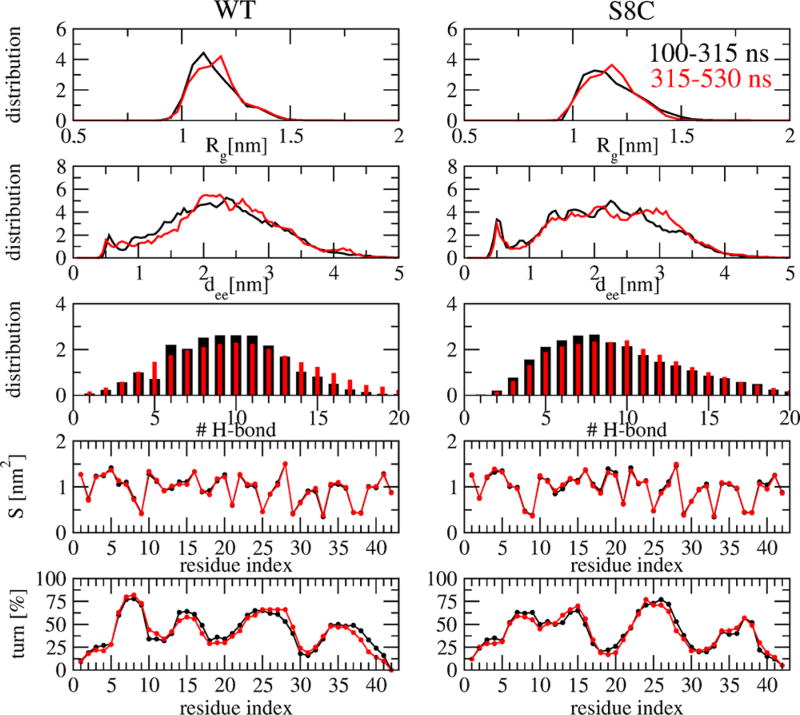
Figure 1.
Convergence of REMD simulations at 315 K. Shown are the distributions of various quantities including the radius of gyration (Rg), the Ca end-to-end distance (dee), the total number of intermolecular hydrogen bonds (H-bond), the SASA (S), and the turn secondary propensity of each residue. The results are calculated for two time intervals 100–315 ns (black curves) and 315–530 ns (red curves). The panels on the left and right display the results of the WT and S8C, respectively.

