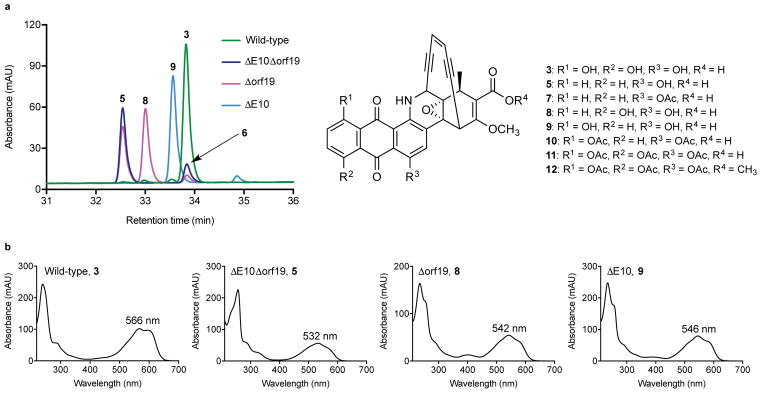
Figure 2. Comparison of enediynes produced by wild-type M. chersina and P450 gene deletion strains.
(a) HPLC chromatograms demonstrating loss of 3 production in P450 mutant strains and accumulation of major intermediates 5, 8, and 9 with indicated structures. P450 mutant and wild-type HPLC traces are shown at 540 and 570 nm, respectively. (b) UV-visible spectrum of 3 compared to the UV-visible spectra of 5, 8, and 9.

