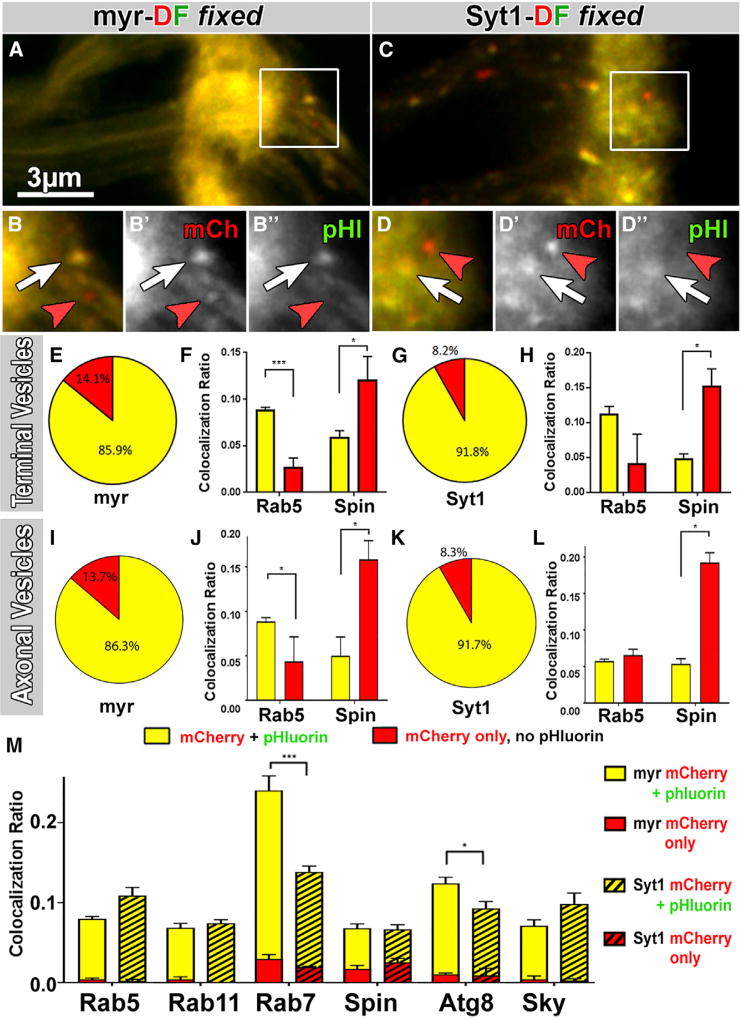
Figure 2. Degradation Starts at Axon Terminals.
(A–D″) Some terminal compartments remain “red only” after fixation (red arrowheads), indicating irreversible damage of pHluorin for both myr-DF (A–B″) and Syt1-DF (C–D″). White arrows mark yellow-fixed compartments.
(E–L) Red-only compartments after fixation are late-stage degradative compartments. Pie charts show ratios of mCherry-only versus yellow terminal compartments (E and G) and axonal vesicles (I and K). Bar charts in (F), (H), (J), and (L) show colocalization ratios of yellow-fixed and red-fixed compartments separately with the early endosomal marker Rab5 and the lysosomal marker Spin (F, H, J, and L). Mean ± SEM; brain n = 15 per probe (E, G, I, and K); brain n = 3 per antibody staining (F, H, J, and L); *p < 0.05; ***p < 0.001; unpaired t test.
(M) Colocalization of myr-DF (non-striped) and Syt1-DF (striped) compartments with markers of the endolysosomal system. Shown are ratios for yellow-fixed and red-fixed terminal hub compartments that colocalize with a given antibody divided by the total number of compartments. The yellow-fixed and red-fixed bars are stacked in the bar chart. Mean ± SEM; *p < 0.05; ***p < 0.001; unpaired t test; brain n = 3–5 per antibody staining.
See also Figure S3.

