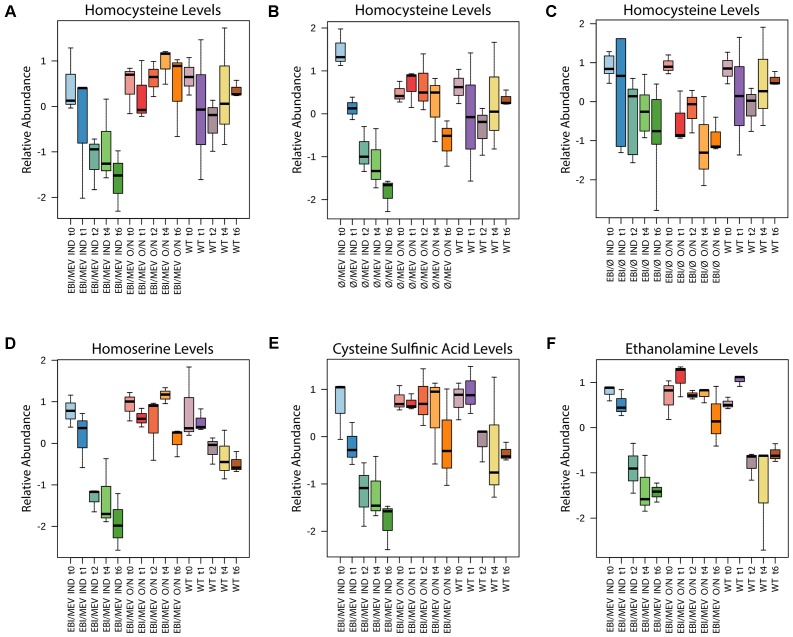
FIGURE 6.
Levels of metabolites of interest plotted over time. (A) Homocysteine levels for overnight- and inoculation-induced pLac32EBI + pBadMEV strains have different trends based on induction condition. The overnight-induced strain appears to maintain higher homocysteine levels over the time course than wild type does. (B) Trends similar to this occur in homocysteine levels for pLac32Ø + pBadMEV strains at each induction condition, except in the overnight-induced strain at hour 6. (C) Homocysteine levels are almost identical at all time points for both overnight- and inoculation-induced pLac32EBI + pBadØ strains. (D) Homoserine levels in pLac32EBI + pBadMEV strains have similar trends to the ones seen in homocysteine. (E) Cysteine sulfinic acid and (F) ethanolamine trends are nearly identical to those in homoserine for pLac32EBI + pBadMEV strains. “O/N” indicates overnight induction; “IND” indicates inoculation induction. Box and whisker plots depict the normalized peak areas. Black lines are the medians, and boxes are the middle 50% values. Error bars represent standard deviation.

