. 2018 Apr 23;9(18):4352–4358. doi: 10.1039/c8sc01023d

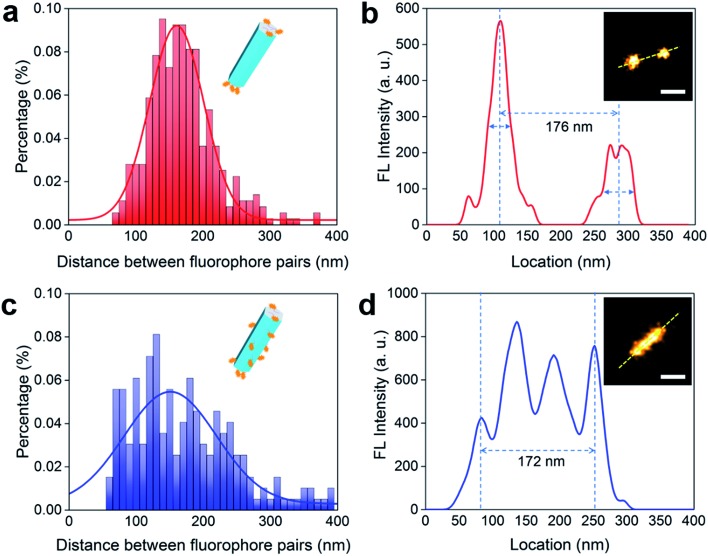
Fig. 3. STORM imaging to visualize the facet selective DNA binding to upconversion nanorods. (a and b) Selective binding of DNA molecules on the end (001) facets of UCNP nanorods. (a) Histogram of the distribution of the distance between the two separated fluorescent peaks measured on a batch of upconversion nanorods (170 nm in length). The distance is determined by the method in (b). (b) The fluorescent intensity line profile of a nanorod labelled by a pair of ATTO-550 clusters (inset: STORM image of a nanorod with ends labelled by fluorescent dyes). (c and d) Isotropically modified nanorods display multiple and random fluorescent clusters. (c) Histogram of the distances between two fluorescent peaks for a range of upconversion rods, which are determined according to the method shown in (d). (d) The fluorescent signal profile of a representative nanorod that is isotropically labelled by ATTO-550 dyes (inset: STORM image of the isotropically dye-labelled upconversion nanorod). More STORM results can be found in ESI Section 4. Scale bar: 100 nm.

Fig. 3