. 2018 Apr 16;10(16):7769–7779. doi: 10.1039/c8nr00196k

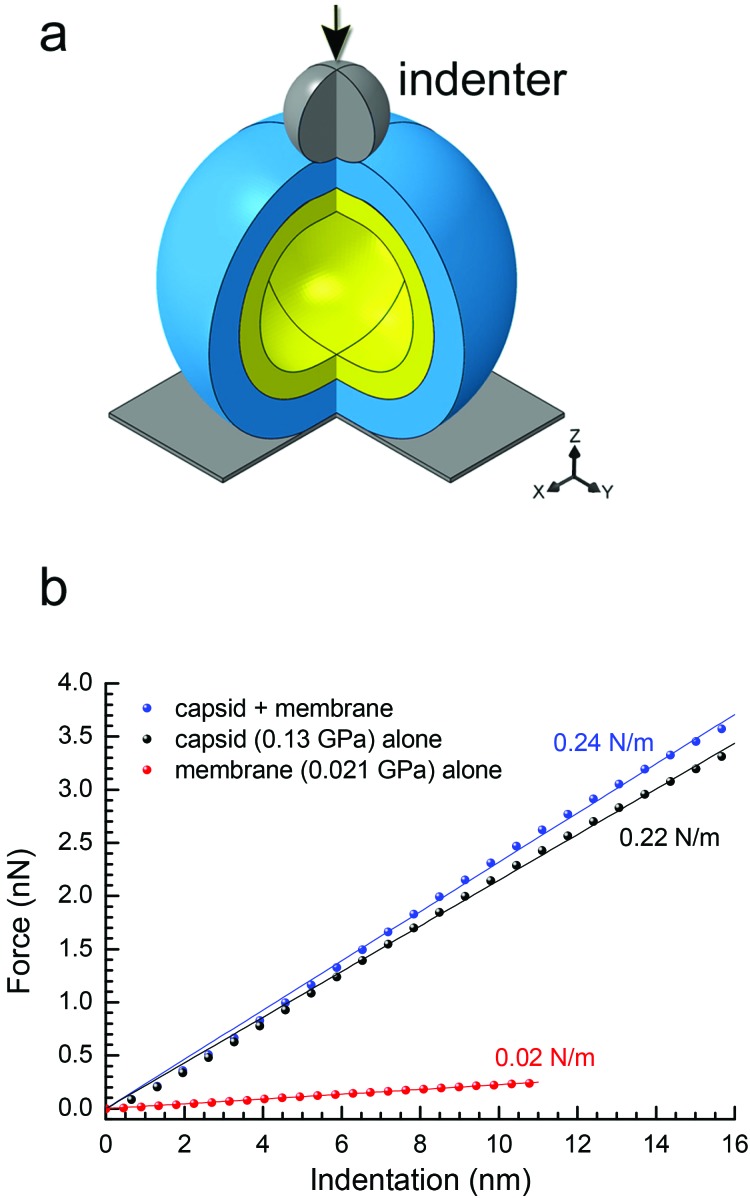
Fig. 4. (a) Schematic of the spherical two-shell model (outer protein shell in blue, inner vesicle shell in yellow) for the finite-element modelling; three-quarters of the spheres are shown with the indenter apex represented as a grey sphere with the direction of the applied force as indicated by the black arrow; in the bottom right corner, the Cartesian coordinate system; (b) predicted curves of force vs. indentation for a protein shell (with E = 0.13 GPa, representing the P3-shell; black dots), a vesicle shell (with E = 0.021 GPa, representing the proteo-lipidic vesicle; red dots) and a composite of these protein and vesicle shells (blue dots). In matching colours: lines are linear fits through the origin, and texts the stiffness values corresponding to the slopes. The stiffness values of protein and vesicle shells match the experimental data for P3-shell and vesicle (Fig. 3a), respectively, confirming the correct choice of Young's modulus values; the stiffness of the composite is well approximated by the sum of the stiffness values of the constituent shells and thus only marginally larger than the stiffness of the protein shell alone.

Fig. 4