. 2018 Mar 26;14(16):3057–3062. doi: 10.1039/c8sm00224j

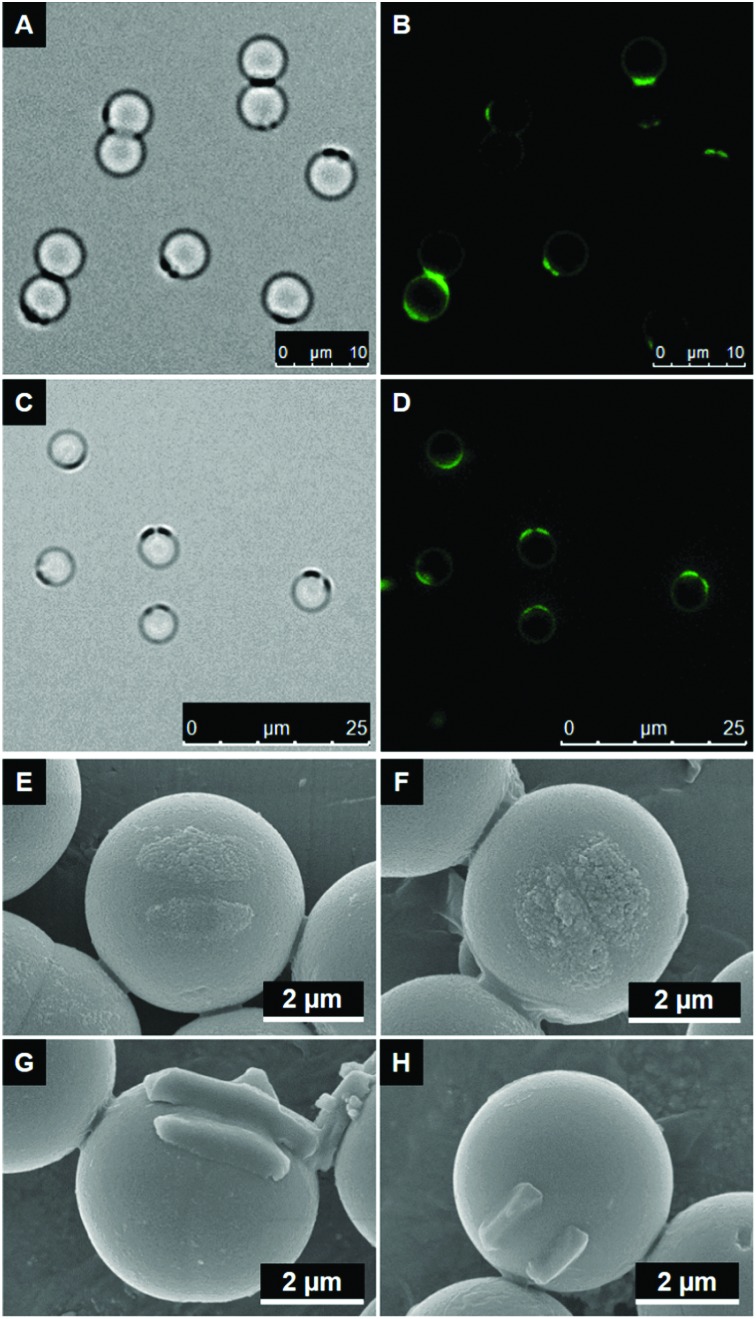
Fig. 2. (A–D) Bright field and fluorescence images of silica particles (5 μm) after printing with original stamps with a wavelength of 1.5 μm (A + B) and with cast stamps with a wavelength of 3 μm (C + D). Particles were removed with ethanol and patches were labeled with FITC. (E and F) SEM images to compare patch size after printing with original wrinkle stamps (A) and cast wrinkle stamps (B) with 4 wt% PEI. Particles were removed with ethanol. (G and H) SEM images of silica particles (5 μm) after printing with stamps with a wavelength of 1.5 μm and PEI concentrations of 4 wt% (C) and 2 wt% (D). In this case, particles were removed by acetone.

Fig. 2