. 2018 May 1;10(18):8413–8421. doi: 10.1039/c8nr00603b

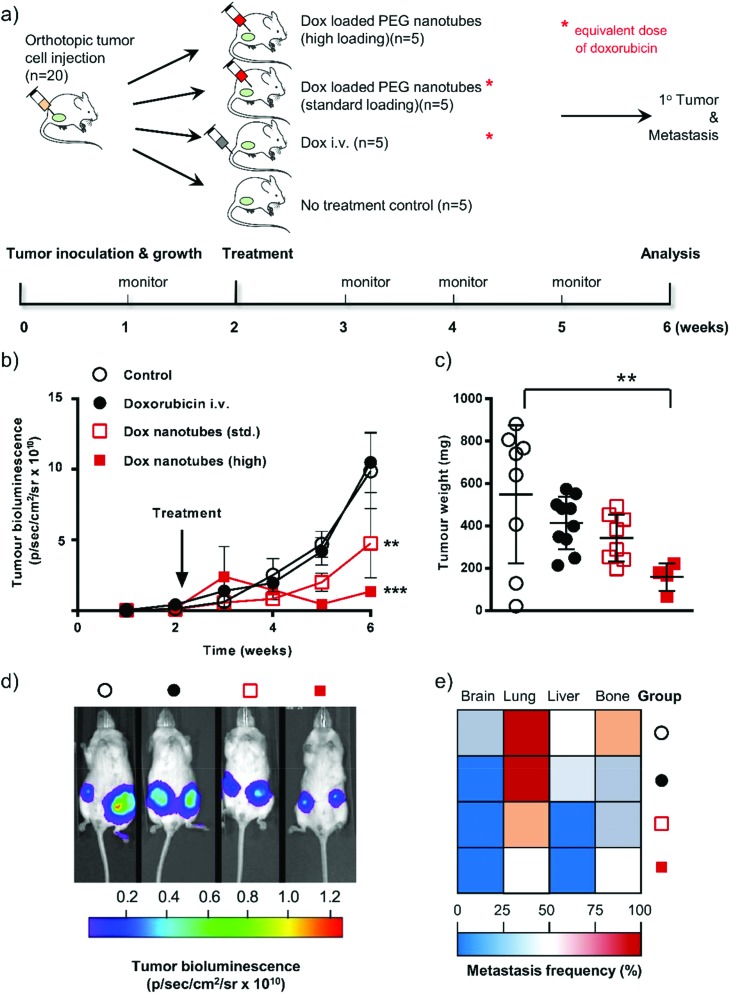
Fig. 4. In vivo response of doxorubicin-loaded nanotubes in human orthotopic breast cancer. (a) Schematic diagram of the experimental approach showing the timeline and description of the groups. (b) Tumor growth in mice either untreated (open circle), 80 μg of doxorubicin by intravenous bolus injection (black circle), or doxorubicin-loaded nanotubes (standard dose 2 × 40 μg doxorubicin (open square) or high dose 2 × 80 μg of doxorubicin close to the bilateral orthotopic tumors). (c) Primary tumor weights were assessed at the end of the study (week 6). (d) Representative cancer cell-specific bioluminescence composite images at week 6. (e) Metastatic spread of cancer cells to organs at week 6. Statistical differences were determined using ANOVA (see materials and methods) **P ≤ 0.01, ***P ≤ 0.001; error bars represent ±SEM for tumor growth and ±SD tumor weights and are hidden in the plot-symbol when not visible, n = 4.

Fig. 4