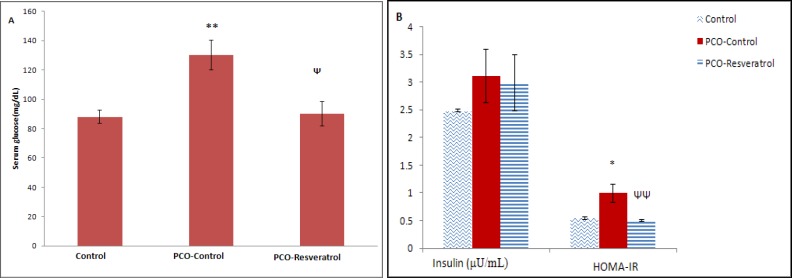
Figure 5.
The fasting serum glucose levels (mg/dL) (A); the fasting serum insulin levels (μU/mL) and the HOMA-IR index (B) in the different groups at the end of the study. Each group had 5 rats. The data are given as Mean±SEM.
**Significantly different from the Control group (p<0.01)
Ψ Significantly different from the PCO-Control group (p<0.05)
* Significantly different from the Control group (p<0.05)
ΨΨ Significantly different from the PCO-Control group (p<0.01).

