
Figure 2.
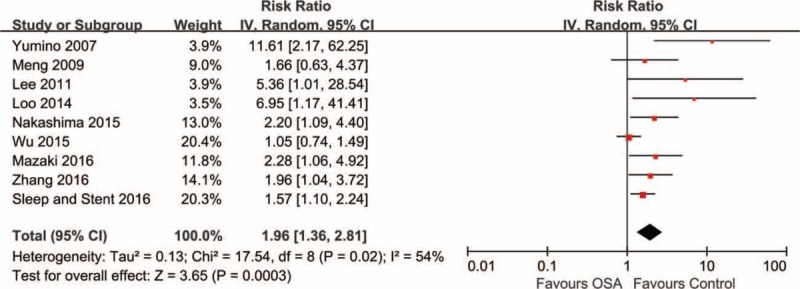
Risk estimates for MACE. Forest plot displays the risk ratio with 95% CI for MACE in patients with OSA compared to control. The diamond indicates the point estimate, and the left and right end of the line indicate the 95% CI. CI = confidence interval, IV = inverse variance, MACE = major adverse cardiovascular events, OSA = obstructive sleep apnea.