
Figure 3.
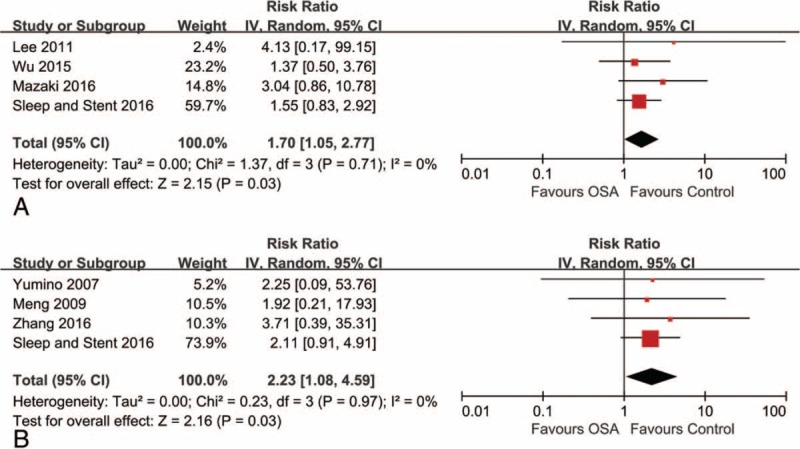
Risk estimates for all-cause death and cardiovascular death. Forest plot displays the risk ratio with 95% CI for all-cause death (A) and cardiovascular death (B) in patients with OSA compared to control. The diamond indicates the point estimate, and the left and right end of the line indicate the 95% CI. CI = confidence interval, IV = inverse variance, OSA = obstructive sleep apnea.