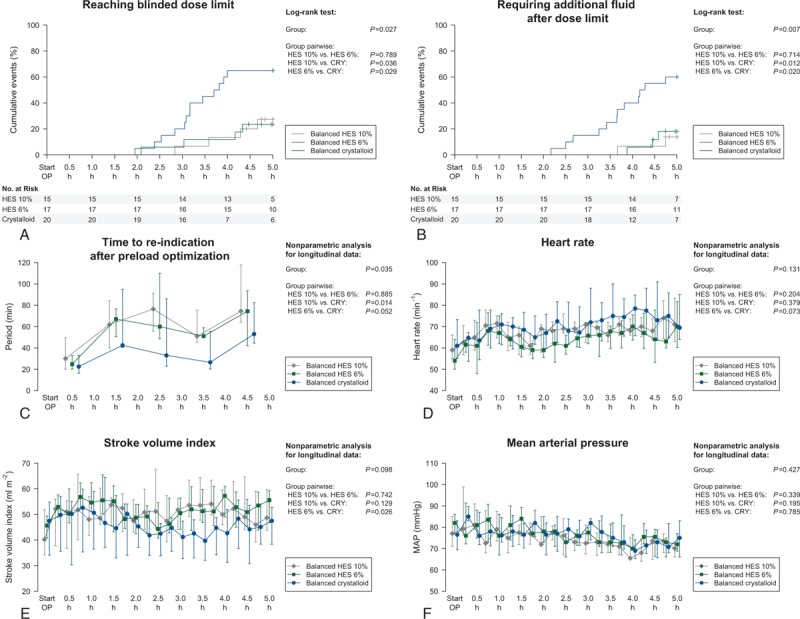
Figure 2.

Kaplan–Meier curves for reaching blinded dose limit (A) and requiring additional fluid after dose limit (B) and intraoperative time courses of time to re-indication (C), heart rate (D), stroke volume (E), and mean arterial pressure (F). Data are shown as cumulative events with 95% confidence interval (A, B) and median and (25%; 75%) quartiles (C–F), respectively. Results of the log-rank test (A, B) and the nonparametric analysis (C–F) are indicated.
