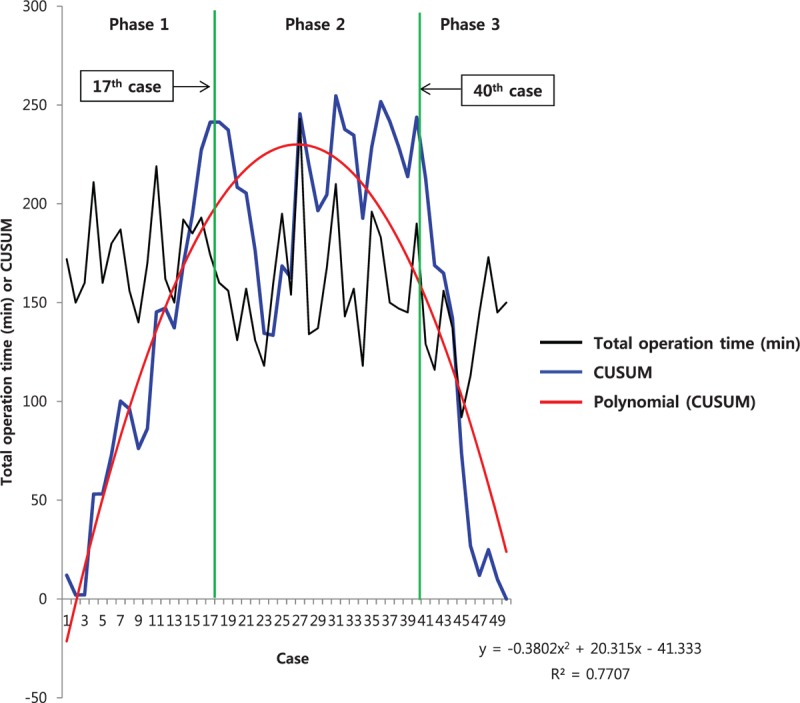
Figure 1.

Total operation time (black line) and cumulative sum (CUSUM)OT (blue line) plotted against case number. The red line represents the best fit for the plot using a second-order polynomial with equation CUSUMOT = –0.3802 × case number2 + 20.315 × case number – 41.333 (R2 = 0.7707), corresponding to 3 distinct phases of the total operation time.
