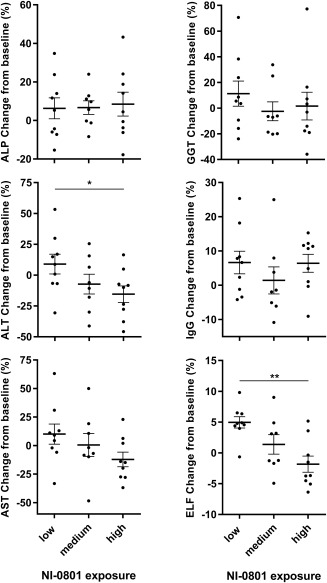
Figure 2.

Change of baseline from clinical effect parameters (ALP, ALT, AST, γGT, IgG, and ELF) on D85 by the level of NI‐0801 exposure achieved. Bold horizontal bar indicates mean, error bars indicate SEM; P values were derived using two‐tailed unpaired t test (*P < 0.05, **P < 0.005).
