
Figure 2.
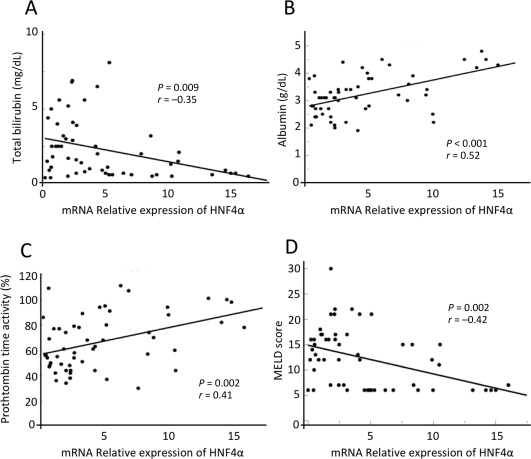
Regression analyses between HNF4α expression and clinical parameters. Gene expression levels in Child‐Pugh A, B, and C patients' samples were analyzed according to the Ct method with the amount of target normalized to β‐actin and relative to a control sample. Scatterplots are shown depicting the correlation between the expression of (A) HNF4α and total bilirubin level, (B) serum albumin, (C) prothrombin time activity, and (D) MELD score.