Figure 6.

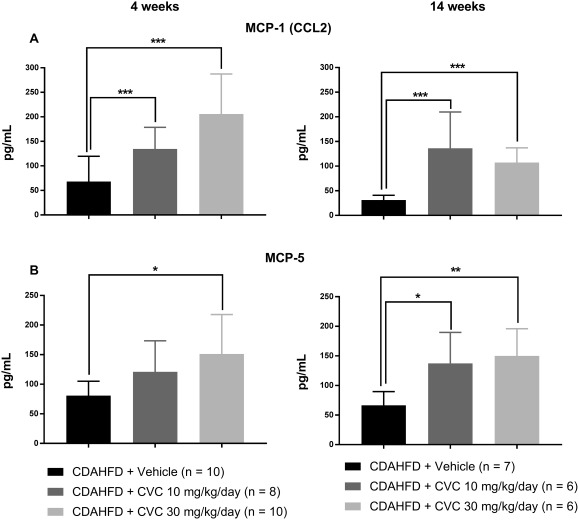
Serum chemokines increased at both 4 and 14 weeks of CVC therapy. Data represent mean ± SD. (A) Monocyte chemotactic protein 1/chemokine ligand 2. (B) Monocyte chemotactic protein 5. *P = 0.02, **P = 0.01, ***P ≤ 0.006.

Serum chemokines increased at both 4 and 14 weeks of CVC therapy. Data represent mean ± SD. (A) Monocyte chemotactic protein 1/chemokine ligand 2. (B) Monocyte chemotactic protein 5. *P = 0.02, **P = 0.01, ***P ≤ 0.006.