
Figure 8.
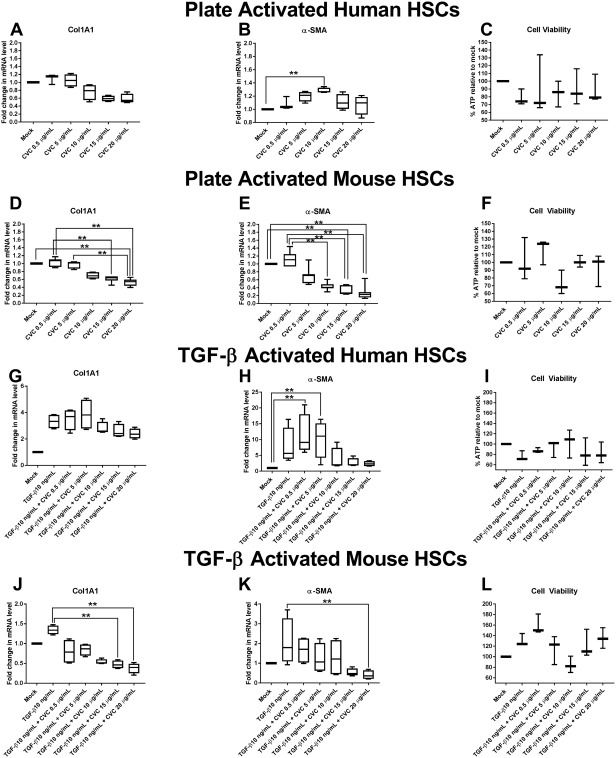
Quantitative polymerase chain reaction of profibrogenic gene transcripts from in vitro plate‐activated (A,B) human pHSCs or (D,E) mouse pHSCs or in vitro TGF‐β‐stimulated (G,H) human pHSCs or (J,K) mouse pHSCs in the presence or absence of CVC at increasing doses ranging from 0.5 μg/mL to 20 μg/mL. mRNA expression is reported as fold increase compared with mock‐treated cells and normalized to GAPDH for each treatment condition. Data represent four independent experiments in human pHSCs and six independent experiments in mouse pHSCs. Data represent median with IQR, min and max. Cell viability for each experiment type was performed in triplicate and (C,F,I,L) is represented as percent ATP in cells in each treatment condition relative to mock‐treated cells. Abbreviations: GAPDH, glyceraldehyde 3‐phosphate dehydrogenase; mRNA, messenger RNA **P ≤ 0.05.