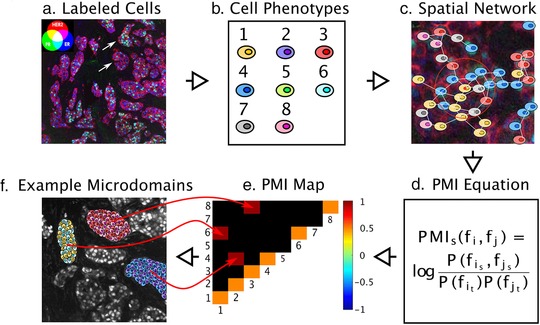
Figure 2.

Pointwise mutual information (PMI) for quantifying spatial heterogeneity. (a) A pseudo‐colored multichannel fluorescence image labeled iteratively by the MultiOmyx platform is shown for an estrogen receptor (ER)+ invasive ductal carcinoma from a tissue microarray. Three biomarker channels were used to demonstrate the approach: HER2 (red), ER (blue), and PR (green), although this method can be scaled for >50 biomarkers. Areas of PR/ER co‐activation will appear in cyan, HER2/ER co‐activation in magenta, and PR/HER2 co‐activation in yellow. The upper and lower arrows indicate heterogeneous tumor microdomains with higher than average ER+/PR+ phenotyped cells and mostly ER+ cells, respectively. (b) Machine learning methods can be used to identify dominant cellular phenotypes from biomarker expression patterns over an entire tissue microarray, which in this case were eight. Each cell is then classified with the most similar dominant phenotype. (c) In order to represent the tumor topology, a spatial network of the cells in each tissue microarray spot or whole tissue section is constructed, in which each cell has the ability to communicate with nearby cells up to a certain limit, 250 μm,59 and the communication propensity is assumed to be inversely proportional to the cellular distance. (d) PMI quantifies the statistical associations, both linear and non‐linear, between each pair of cellular phenotypes. In particular, PMI calculates the logarithmic joint probability of finding a particular pair of cellular phenotypes occurring in close proximity, relative to the probability of these phenotypes co‐occurring at random. (e) By referencing a specific interaction pair in the PMI plot, one can interrogate the network subgraphs/motifs that contribute to the PMI dependencies. A PMI map with strong diagonal entries and weak off‐diagonal entries describes a globally heterogeneous but locally homogeneous tumor. On the contrary, a PMI map with strong off‐diagonal entries describes a tumor that is locally heterogeneous. (f) An example TMA spot with three locally heterogeneous tumor microdomains denoted by the off‐diagonal entries in the PMI map, containing phenotypes 1 and 6, 2 and 4, and 3 and 8. PMI maps can also portray anti‐associations (e.g., if phenotype 1 never occurs spatially near phenotype 3). The ensemble of associations and anti‐associations of varying intensities along or off the diagonal represent the true complexity of tumor images in a format that can be summarized and interrogated. PMI maps are predicted to become diagnostic and prognostic biomarkers.
