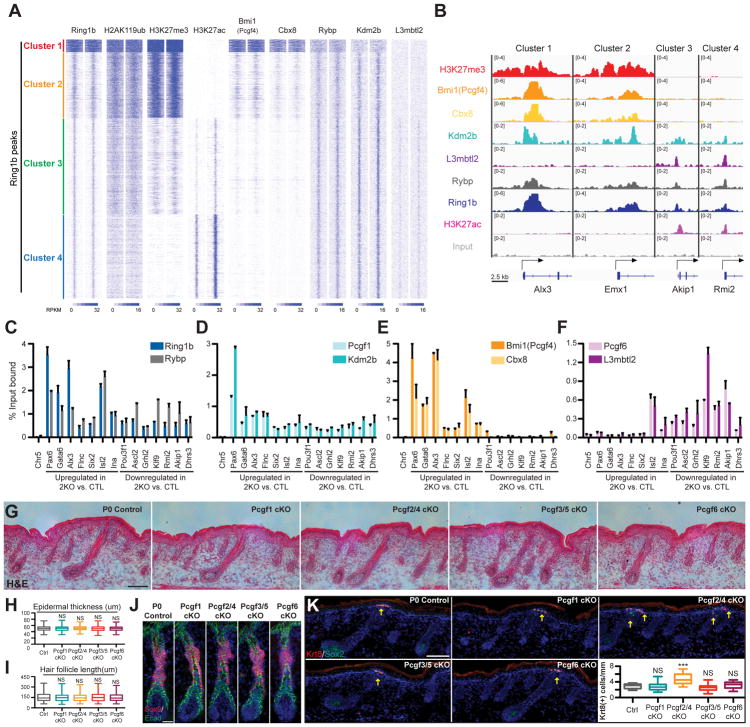
Figure 6. PRC1 complexes function redundantly in skin epithelium development.
(A) Heatmap of ChIP-Seq signals across Ring1b-peaks for Ring1b, H2AK119ub, H3K27me3, H3K27ac, Bmi1, Cbx8, Rybp, Kdm2b, and L3mbtl2 in control epidermal progenitors, with input signal subtracted. (B) IGV browser views of Ring1b, H3K27me3, H3K27ac, Bmi1, Cbx8, Rybp, Kdm2b, L3mbtl2, and input for indicated genes. (C–F) ChIP-qPCR showing the binding of Ring1b and Rybp (C), Bmi1 and Cbx8 (D), Pcgf1 and Kdm2b (E) and Pcgf6 and L3mbtl2 (F) in control epidermal progenitors. Data are mean ±SEM, n=2. Genes with absolute fold change ≥1.8 and false discovery rate (FDR) <0.05 in 2KO vs. control epidermal progenitor cells were defined as differentially expressed. (G–I) H&E analysis of P0 skins of Pcgf1 cKO, Pcgf2/4 cKO, Pcf3/5 cKO, and Pcgf6 cKO mice compared to controls. Note comparable epidermal thickness (G and H) and hair follicle length (G and I). Quantifications presented in (H and I). n=3. (J) IF staining for HF-SC marker Sox9. Scale=25μm. (K) IF analysis of Krt8+ Merkel cell numbers. Note the increase in Merkel cells in Pcgf2/4 cKO skin compared to control. n=4. Scale=100μm in figures 6G and K. Data in figures (H, I and K) are presented as boxplots. ***p<0.001; NS, not significant (two-sided t test). See also Figure S7 and Table S4.

