Figure 2.

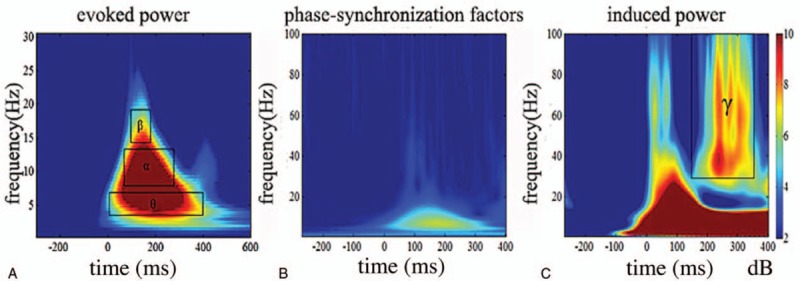
Contrast of evoked power (A), induced power (C), and phase-synchronization factors (B) in all subjects. The horizontal axis shows the time range, and the vertical axis shows the frequency range.

Contrast of evoked power (A), induced power (C), and phase-synchronization factors (B) in all subjects. The horizontal axis shows the time range, and the vertical axis shows the frequency range.