
Figure 3.
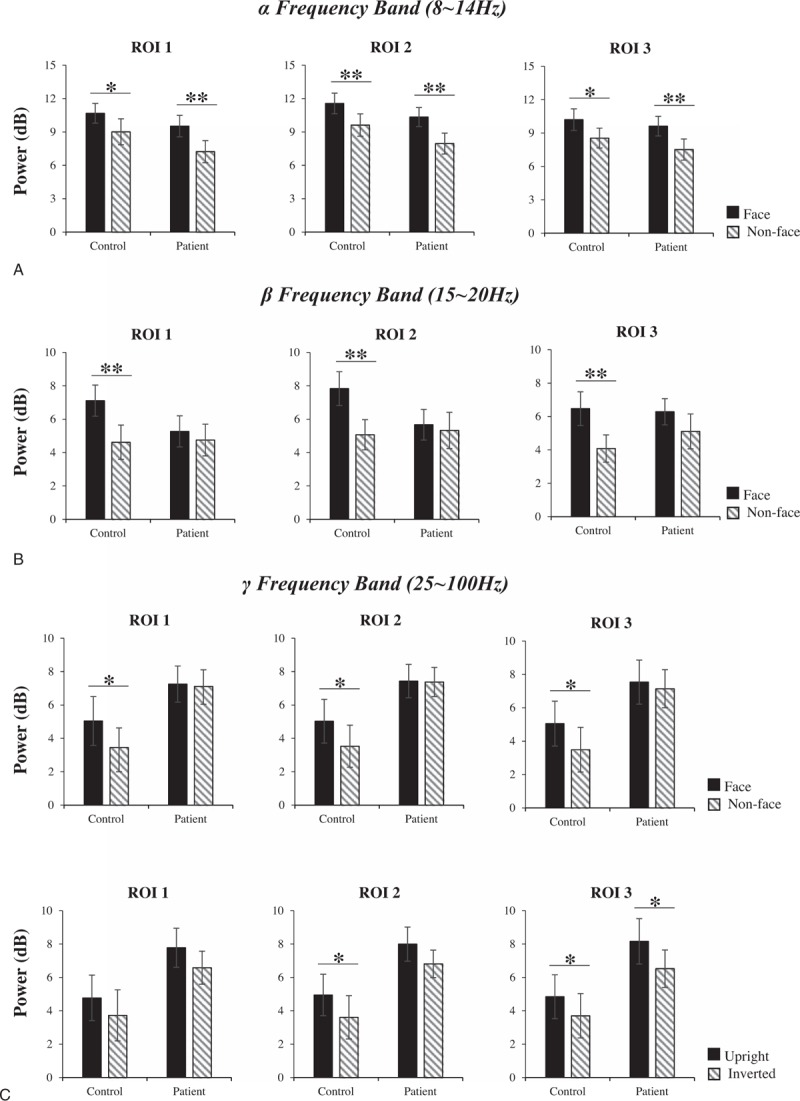
Within-group analysis of the evoked power in the α frequency band (A), β frequency band (B), and the induced power in the γ frequency band (C). In each graph, the horizontal axis shows the group name: control and patient, and the vertical axis shows the evoked power. The black box or diagonal stripes box represents the stimulus conditions. The bar graphs display the mean of standard error of the power for the controls or patients in different stimulus conditions. ∗P < .05, ∗∗P < .01.