
Figure 1.
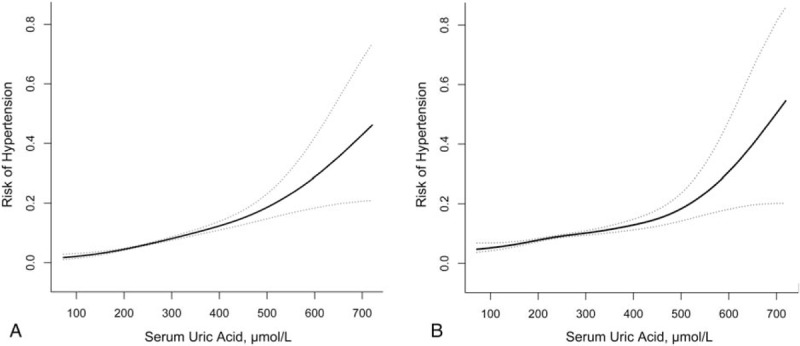
Curve-fitting of serum uric acid and risk of hypertension. (A) Unadjusted and (B) adjusted for age, sex, body mass index, systolic blood pressure, diastolic blood pressure, creatinine clearance rate, fasting plasma glucose, triglycerides, total cholesterol, high-density lipoprotein cholesterol, and low-density lipoprotein cholesterol.