
Figure 4.
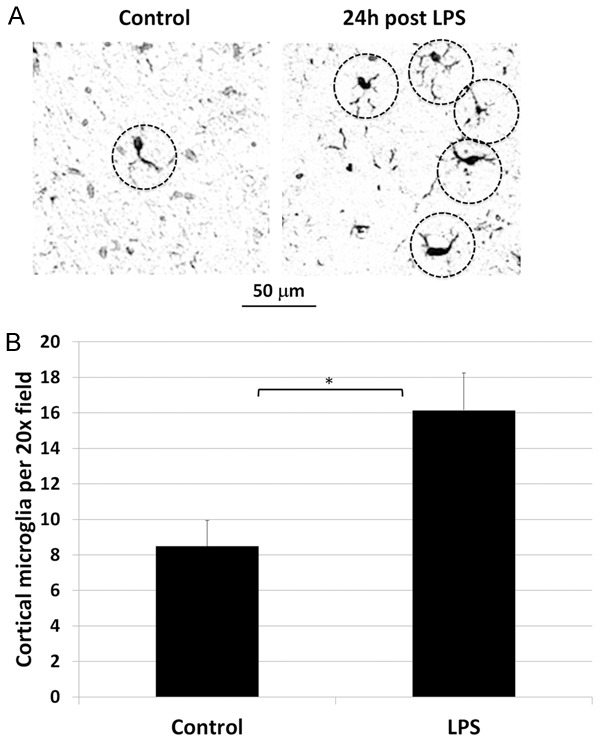
Effect of LPS on cortical microglial density. A. Representative photomicrograph of Iba-1 immunostained cortex of control (left) and LPS-treated (right) rats show cell bodies with elongated processes (dashed circles), typical in shape of microglia, visually more numerous in the LPS treated rat. B. Cortical microglia were quantified 24 h post LPS administration and were significantly increased at 1.9 times control levels. Statistically significant difference noted: (*).